Two weeks ago, I introduced you to my new module SVG::TrafficLight and hinted that there were more SVG-based modules to follow. Today, I’d like to talk about the next one – SVG::Timeline.
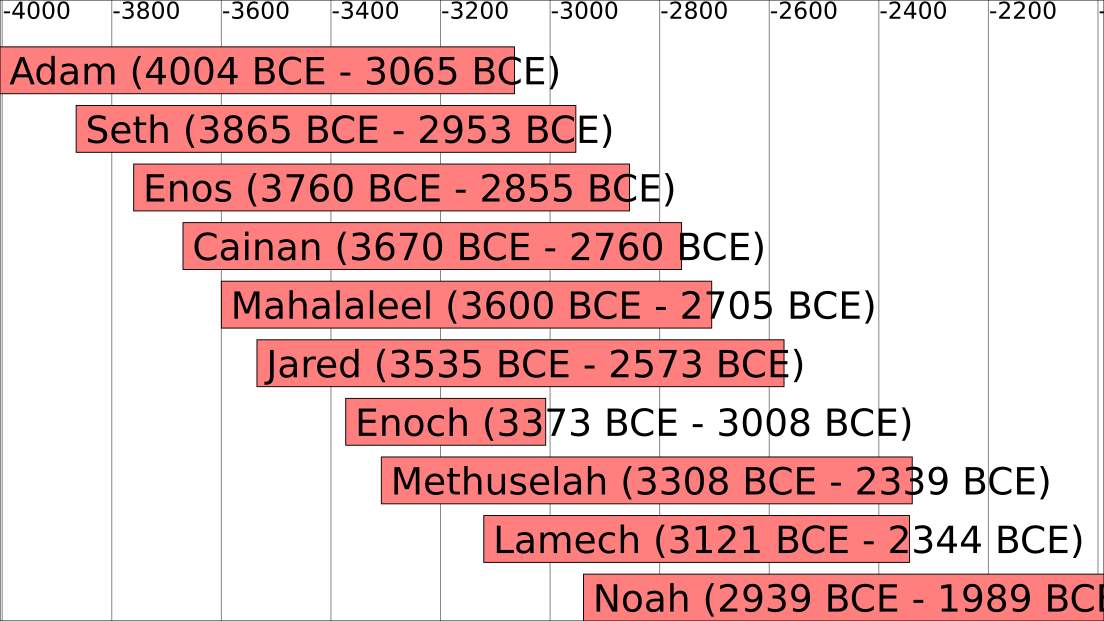
It all started over a year ago when I was looking through some of the more ridiculous religious questions on Quora when I came across one asking why Adam wasn’t mentioned in the Bible after the first couple of books in Genesis. As part of my answer I wanted to illustrate just how long a time Genesis 5 covers.
I knew that SVG would be the best approach and it only took half an hour or so to whip up the image you can see in my answer (and there’s a newer version, generated with the current version of the code, at the top of this page). It’s important to note that I didn’t hand-craft SVG that drew the diagram – I wrote code that generated the diagram from an input file.
I then realised that this could be a more generally useful tool, so I set about making the code more generic. It languished on Github for a year or so before I decided it was useful enough to clean it up and release it to CPAN. Let’s take a quick look at how it works.
As you can see from the example above, a timeline is made up of a number of events. An event has a start date, an end date and some text. So you can start a timeline diagram with code like this:
|
1 2 3 4 5 6 7 8 9 10 11 12 13 14 15 16 17 |
use SVG::Timeline; my $doctors = SVG::Timeline->new; $doctors->add_event({ text => 'William Hartnell', start => 1963, end => 1966, }); $doctors-> add_event({ text => 'Patrick Troughton', start => '1966, end => '1969, }); ... |
And once you have added all of your events, you can produce the timeline using:
|
1 |
print $doctors->draw; |
That code writes the SVG document is written to STDOUT, so you’ll probably want to redirect that to a file.
That will draw a timeline of your events using all of the default settings (which, in most cases produce a useful diagram). There are plenty of options that you can pass to the object constructor to tweak things. The most useful are probably the aspect ratio (if your diagram is going to be particularly long or thing – the default is 16/9) and the number of years between gridlines in the output (the default is ten and you might want to change that if your timeline covers a particularly large or small number of years – like the Genesis example above).
The default behaviour is to colour all of the events the same colour (which can be changed from the default in the constructor for the SVG::Timeline object). But you can also change it for each individual event by adding an optional “colour” parameter to the add_event() call.
But that’s all a lot of work for the simple case. So the distribution also includes a command line program called timeline which does all of that for you. It reads a datafile and produces a timeline diagram based on the contents.
Each record in the input file has three or four fields separated by tabs. The fields are the parameters for the add_event() call in the order: text, start, end and (optionally) colour.
There are example data files in the distribution for producing some of the timelines I’ve talked about in this article – along with shell scripts showing how to produce timeline diagrams using the command line program.
There are a few things I’d like to add. Support for events with unknown dates (perhaps fading the colour towards the unknown end). Diagrams that go vertically instead of horizontally and support for events that begin and end in the same year (currently, they are zero size and just vanish – I discovered that when I added Paul McGann and Christopher Eccleston to the Doctor Who example).
I find the program… well, if not exactly useful, it’s still fun to play with.
Please let me know if you produce any interesting timelines with it.

I like it. On a related note as far as these sorts of data structures I recently released Set::Segment tree which is great for querying such a data set. ‘which intervals are intersected by this value’ or in your representation, which ones intersect a vertical line. I think I will use your library to make k graphical illustrations for it!
One para contains ‘three or fields’ when I suspect it should say ‘two or three’.
Thanks for this. It looks interesting.
Have you considered adapting it to handle times within a day?
A Perl module that could show events within a day would be very valuable e.g. a series of events on a database server.
When investigating performance problems these types of graph are really helpful because they can show when processes clashed and tried to use the same resources